
In this blog I show how Value Stream Mapping (VSM) is able to quickly indicate the NON value added process steps.
The goal is to reduce the processing time, the processing cost, avoiding errors (without decreasing quality).
The technique I’m using is a combination of BPMN with a very small extension of VSM.
Step 1: draw the current state (also known as As-Is) of the process flow
goal: To visualize how currently processing is done.
As an example I’ve taken a destillation process and modeled using swimlanes.
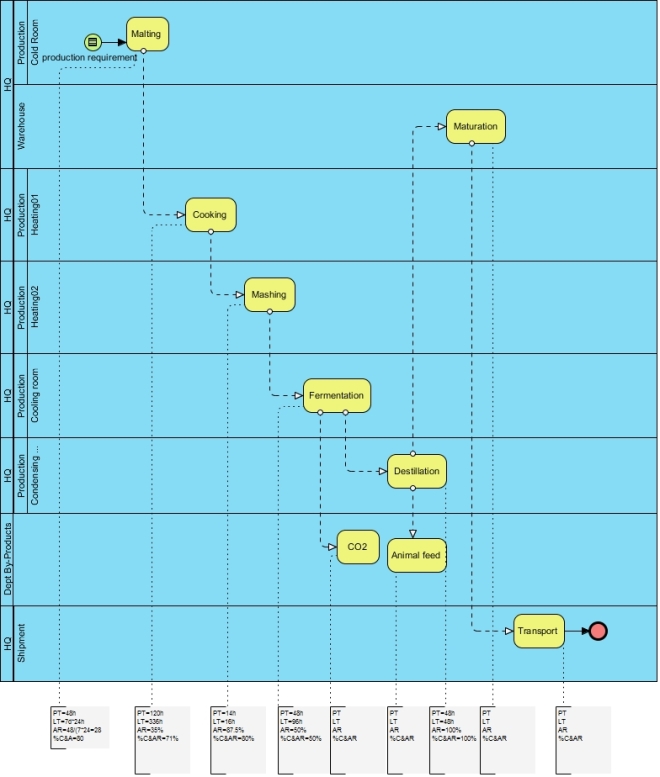
Per process we now add the following metrics (small VSM extension):
- PT = processing time (how long does it take to perform the process)
- LT = lead time (what is the latency between initiation and execution of a process)
- AR = activity ratio = PT / LT * 100
- %C&A = % complete and accurate (determine in % if we needed to return to the previous process to re-ask and update information before we start our process)
Now perform a quick calculation:
- Total PT= sum of all PTs per process
- Total LT = sum of all LTs per process
- PROD AR = product of all ARs = 28/100 * 35/100 * 87.5/100 * …
- PROD %C&A= product of all %C&A = 80/100 * 71/100 * 80/100 * …
The goal is to improve these metrics.
Step 2: draw the future state (also known as To-Be)
Go through the process and determine per action if it is value adding or non-value adding to the product / service sold.
If the quality of a product is not 100%, down stream efficiency decreases by the predecessor’s outcome.
Remodel the process with all stakeholders and subject matter experts by improving tasks and redo a calculation of the metrics, compare both states until feasible to implement the improvement.
This new process flow becomes the future state.
Elements to change your process flow are:
- Value Adding actions (improving) –> VA
– The customer must be willing to pay for it.
– The activity must change the product.
– The activity must be done correctly the first time. - Non-value adding actions (avoiding) –> NVA
– Not valued by the customer.
– Not transforming the service / product
– Not correctly done, rework
eg: administration, accounting, legal, reports, approvals, testing, inspections, transportation.
(1) re-engineering the process flow, verify if competencies are mature enough, valuate if the process is candidate to be in-sourced or out-sourced …
Once the VA & NVA has been determined we prioritize projects to implement the change of processing.
Further improvement / enhancement:
VSM uses a specific set of “symbols” . Each task can be visualised using the VSM symbols.
Adding extra metrics:
- determine the IDLE time per process
- determine the exact labor requirements per process
- determine the freed capacity between the current & future state
At the same moment when improving the processes you are able to determine if “waste” occurs:
- Waiting
- Over Production
- Rejects
- Motion
- Processing
- Inventory
- Transport
It is obvious these tenets are subject to lean management, these topics support your way to improve your process. Get rid of waste.
The model above easily has been designed using the BPMS Visual-Paradigm with an in-depth reporting facility and extensive database.
