
When it comes to documenting processes I’m using a very straight forward technique based upon a “best practice” standardised notation symbols.
Why should we document prcoesses?
- If you can not measure it, you can not control your processes
- If you can not control it, you can not manage your processes
- If you can not manage it, you can not improve your processes !
There are a lot of tools available (even plain word documents will do).
But the main essence is to communicate what’s going on in your organisation about basic pillars:
- processes
- organisation
- data exchange
- IT-solutions
- services & quality measurements
Starting from the top: how to express HOW we are doing things in our organisation.
I take as example a simple order process:
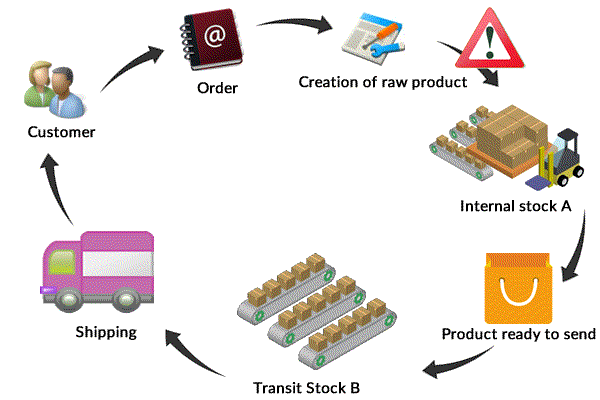
What’s our interest:
- who is doing what?
- what kind of information is exchanged?
- what must be done to move on?
- how it is processed?
Exchanging this simple picture to different persons (production managers, sales responsibles, transportation leaders, IT-guys) makes plenty room for mis interpretation.
Therefore since 1990 (or even earlier) effort has been put together to standardise process documeting.
BPMN (Business Process Management Notation language) owns all capabilities to express the flow of each action at no matter what level of the organisation.
Using BPMN we are able to exchange information amongst all involved parties in a very simple way.
Translating the above scheme into a business process diagram using BPMN symbols:

So what do we know by know:
- we have translated a picture into a standard process flow
- the flow is detailed using a process breakdown structure
- uses standardised (ultra simplified symbols see BPMN process modeling)
OK, nice picture, but what’s the benefit ?
Well we’ve described HOW things are happening. We are making the process flow understandable for all participants, stakeholders (and at no matter what level of the organisation.
Next is to describe the actions.
Upon receipt of a trigger, the action processes the information, prepares the outcome and hands over to the next in-line.
What kind of information do we register?
- the supplier (from whom we have received information)
- the input data we receive
- the process to be done
- the output of the process
- the customer (to whom we drop, who must carry on with the process)
Simply SIPOC analysis: The Supplier (S) delivers the trigger (I)nput, we (P)rocess, and prepare the (O)utput for the Customer.
OK, now we have assembled a process breakdown of a certain flow.
But to what end ?
Well having this information we are challenged to improve the flow its throughput, its leadtime, its “added value”.
Therefore process documentation is telling you all about the WHATs, the WHOs, the WHENs and the TOOLS for each process.
At every step of the flow we are now ready to evaluate and search for better.
For instance:
- if we replace the process scanning of incoming documents by an automated solution what are the benefits/costs
- if we increase training of the employee for order taking, can we decrease the internal failures, the cost of poor quality of processing
- if we increase the no. of employees on peak moments what will be the impact on the leadtime, are we able to compete better with the takt of the customer
Process documentation is becoming mature whenever we take into account all the particles of every simple element of a flow.
For instance:
- a process verifies if conditions are met (example: an order must be created)
- a process consumes a duration, a leadtime (example: creating an order takes 10 minutes)
- a process submits a confirmation mail to the customer (goods will be shipped at day x), or in case out of stock the manufacturing department is informed to create the goods using the specifications of the customer
- etc
Taking this bunch of information in consideration we must keep it understandable to the audience of the processes.
To do this, we enrich the detail of each action of the process flow with the following:
- what’s the name of the action (use a verb then a noun)
- what’s the objective of the action
- what’s the duration, the maximum time to spend
- what’s the deliverable to be produced (an invoice, a bill of lading, customers specifications)
As some processes can be very complicated to express this in 1 action we make use of leveling and classification.
Level1: process categories (the core business of the company) –> finance, operations, human resources
Level2: process groups (the value chains of each level1), example: sales, marketing, manufactoring, shipping)
Level3: processes (the department its operations and responsibilities) –> see the process flow above
Level4: activities (the in-depth description using specific competencies and skills)
Level5: tasks (the further decomposition of a simple activity)
An simple example of this process classification:
L1 process category

Next: for each L1 proces we determine L2 process groups

Next: for each L2 process group we determine L3 process.

Next: for each L3 process we determine the L4-activities.
Option: in case further detailing a L4-activity is needed we determine the L5-tasks (same symbols as for L4)
The process tree level specification L1 – L2 – L3 are pretty much standard.
As starting from L4 / L5 this is the place a company really is able to be different than its competitors.
Benefit of process documentation:
- easy to read
- structured
- no hard learning curve
- open for any granularity of detail
- independent of tooling
- usable for for any type of business
A sample report can be found in the pdf below.
Not all content is provided (what I’ve registered during my workshops), but it gives an overview to what end Process Documentation can support.
*** Process Documentation ITSM example ***
This report is to become the deliverable for better understanding (read improve) business processes.
Tools used: Visual-paradigm
Next steps:
- extend the information in the templates with domain related measurements
- for instance Maximum Resolution Time, Cost of Performce
- KPI’s
- Cost to Perform: number of minutes, daily cost of Human Resources (internal / external), usage of Material
- run a report to determine
- what objects will be impacted if we change for instance an activity
- to remove waste and start up with lean management programmes
- to reduce failures (by means of calculating the cost of poor quality)
- to address the risks, the mitigations, the SPOFs
- to apply the Voice of the Customer (by comparing value chains of core processes)
- …
other examples will be added:
- impact-analysis (what process is impacted if we change this software solution)
- how many and where have we used this application
Overview of the reports:

Where is the L5 map?
The L5 map is per customer different. It is the discriminating factor to do business.
Everyone has his proper view on his layers with regards the mapping of the tasks to IT-infrastructure and IT-architecture.
For instance:
one can use RPA in a level 5 task
but it is clear this will not be published
another customer will use robots for his service desk, of a digital panel
again this will not be published
Are you saying that for an RPA process a Level 5 is required or Can you use the FD for the Level 5?